A CfD strike price is not a system cost. Transmission, balancing, backup, curtailment — where do they land, and on whose bill?
This is the standing thread for building the honest number, piece by piece, with sources.
A CfD strike price is not a system cost. Transmission, balancing, backup, curtailment — where do they land, and on whose bill?
This is the standing thread for building the honest number, piece by piece, with sources.
It’s a trick question much like how long is a piece of string?
The answer depends entirely on the rest of the system. Start with a conventional grid, and add a small wind or solar farm, and the answer might be quite close to a LCOE calculation (at least if you use proper numbers, rather than Lazard fantasy numbers on costs). You can maybe get away without much additional equipment at the connected substation. Doesn’t apply to a tidal stream unit in Orkney or Shetland, because output is so flickery as a result of wave action etc. that it must be fed through a battery to produce a smoothed output: a significant added cost and round trip loss.
Start adding more capacity, and grid stability issues become more significant, so more kit must be added and the operations of other generators have to take account of the consequences - more reactive power for voltage control, reserve to handle sudden dips in wind or clouds, etc. but otherwise it piggy backs on the existing transmission infrastructure (especially now that demand is well below the peaks of 20 years ago). Declining load factors for other generators, and sharper ramping requirements increase their costs and the costs of system balancing.
Increase still further, and peak renewables generation can exceed demand less must-run generation (nuclear, essential inertia/reactive power/short circuit current sources), particularly in low demand hours: we start to see curtailment and cannibalisation of revenues.
In turn, this produces the next layer of cost: adding batteries and other storage, partly to provide some of the stabilisation and balancing, and partly to try to absorb and redispatch surplus power. However, batteries need frequent margin opportunities to earn their keep: effectively charging up and discharging more than once a day if possible. Retaining capacity against weekly demand variations, or significant changes in the weather immediately cuts opportunities by an order of magnitude or more. Seasonal storage is very tough economically: ask Centrica about Rough.
We also enter the realms where backup capacity must be paid for simply to be available, adding another layer of cost, which can become very costly when capacity has to be replaced, rather than merely kept operational. Relying on others to provide the service via interconnectors is high risk, and of course, another layer of cost.
As renewables capacity increases still further its peak output and more distant location from demand results in substantial, costly grid upgrades. Not all of these are justifiable when the power has a low or negative value.
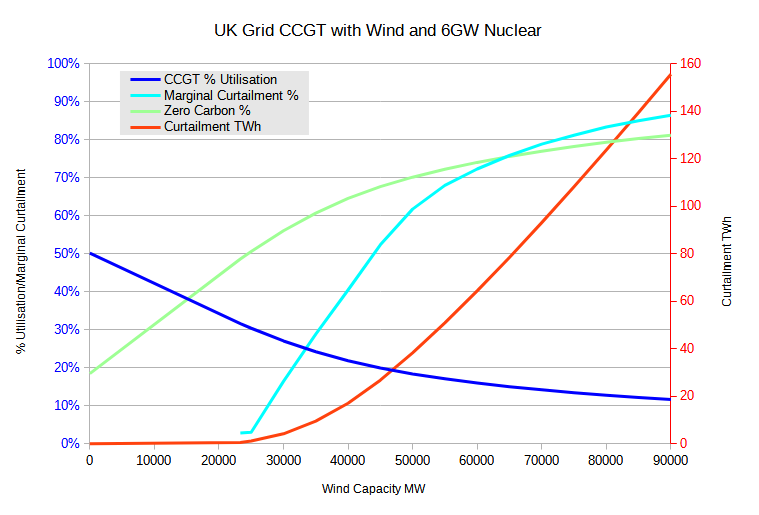
Keep going, and the number of hours with renewables surpluses starts increasing, while the size of surplus in lower demand hours grows, so we see a quadratic increase in curtailment volume and a linear increase in marginal curtailment. Eventually, the number of hours with surplus grows more slowly - yet there are periods of Dunkelflaute which barely benefit at all from the now much higher capacity. The marginal useful output from adding more capacity is only a small fraction of the output potential - so the cost has to be borne by the small useful element, multiplying it substantially. It also radically slows the rate at which alternative generation is replaced in supply - yet we still need full dispatchable capacity against Dunkelflaute conditions.
The chart is slightly stylised (points plotted every 5GW), but based on real GB hourly demand (average ~35GW) and wind generation, scaled per the X axis, attributing all other generation after the 6GW baseload to “CCGT” which is sized to meet peak demand at 0 wind capacity, based on 2017 data: it is meant to illustrate the points rather than being a definitive picture. No storage is assumed.
We can start by multiplying an LCOE figure by 100/(100-Marginal Curtailment %), so by 70GW of wind we’re at 5x LCOE, which rather outweighs even the massive marginal grid investment (which actually becomes less because there is less marginal useful output to deliver from remote locations, and the by then existing grid suffices most of the time).
What this clearly shows in that we are at the foothills of a major cost expansion, and unlike Ed Conway’s comforting assertion in his New Statesman article echoing propaganda from NESO/CCC/DESNZ it will not get diluted in a decade or so.